The Econophysics Blog

This blog is dedicated to exploring the application of quantiative tools from mathematics, physics, and other natural sciences to issues in finance, economics, and the social sciences. The focus of this blog will be on tools, methodology, and logic. This blog will also occasionally delve into philosophical issues surrounding quantitative finance and quantitative social science.

Tuesday, April 25, 2006

Biased Coin Flips & Math of Magic at MIT

Persi Diaconis, a professor of mathematics and statistics at Stanford, demonstrated that flips of fair (unbiased) coins can be biased. Using a contraption built to make and measure coin flips in a consistent manner, Prof. Diaconis and his co-authors found that a flipped coin will land as it started 51% of the time. This is contrary to textbook conventions where an ideal coin flip should have a 50% probability of coming up either head or tail. The title of the research paper is, Dynamical Bias in the Coin Toss, and can be downloaded by clicking the link.

There should be at least two caveats to this finding:

(1) In most real world conditions, the coin toss will neither be consistent nor take place under ideal conditions. This inconsistency actually aids in making coin flips less biased than the research would suggest.

(2) This research is consistent with the notion that coin flips are really deterministic chaotic processes rather than nondeterministic random processes. In other words, because a coin flip is highly sensitive to the conditions under which it takes place, that sensitivity makes the result less predictable (rather than the unpredictability being due to an inherent property of 'true' randomness).

When I was in elementary school, I figured out a trick whereby I could almost always guess the coin flip. My third grade teacher would have a very precise and consistent procedure for flipping and catching a coin. Just as Prof. Diaconis' research suggests, once I knew which side was 'up' at the start of a coin flip, I could simply count the revolutions in the air, see how it was caught and flipped over, and correctly 'guess' the result. My teacher was so consistent and precise that I got close to guessing correctly a 100% of the time.

Speaking of tricks, the motivation behind posting this blog entry was that I noticed Prof. Diaconis is giving a lecture on Mathematics and Magic Tricks at MIT (under the sponsorship of the Clay Mathematics Institute) tomorrow, April 25, 2006, at 7 pm. This is a public lecture, so I would urge people in the Boston/Cambridge, MA area to attend. (This is one of those times when I wish I was still living in the Boston area.)

By the way, Prof. Diaconis is a bit of a hero of mine because of the way he obtained his PhD in Mathematical Statistics at Harvard. At the age of 14, he dropped out of school and became a traveling magician, not to return to formal education again until he enrolled in evening math classes at City College New York at age 24 (and the main reason why he did that was to try to beat a casino that was using shaved dice by attempting to understand the math behind dice throws). Despite his unorthodox background, and rather raw mathematical abilities, Prof. Diaconis was able to get into Harvard based on a recommendation by legendary games guru, Martin Gardner, and the good graces of legendary statistician, Fred Mosteller.

May his story give hope to the rest of us!

Monday, April 24, 2006

‘Mind Time’ & Market Time

“Time is nothing but the form of inner sense, that is, of the intuition of ourselves and our inner states …”
-- Immanuel Kant, Critique of Pure Reason [1]

“Time does not run in a straight line, like the markings on a wooden ruler. It stretches and shrinks, as if the ruler were made of balloon rubber. This is true in daily life: We perk up during high drama, nod off when bored. Markets do the same.”
-- Benoit Mandelbrot and Richard Hudson, The (Mis)Behaviour of Markets [2]

‘Time flies when you’re having fun.’ That old cliché is one way of summarizing the concept of mind time. As conceived of by neuroscientists, philosophers, and others interested in human cognition, mind time is a conception of time where we draw a distinction between how time is measured via clocks and how we perceive the passage of time. In this blog essay, I will make the argument that, in the financial markets, time – in terms of mind time – is stretched, contracted, and deformed in a way that is distinctly different to clock time (defined here as time measured via clocks and calendars). The various re-shaped mind times that exist among traders and investors are aggregated in the marketplace to form what I call market time. The concept of market time is, again, distinct from clock time, which is what we normally use to mark off the passage of time. Market time, which may be thought of as the application of mind time to the financial markets, has major consequences for the nature of financial risk and return.

Does time have shape? If so, can you re-shape time?

Does time have shape? This is both a simple yet, paradoxically, profound question to ask and answer. Most people, even scientists, would say that time can be thought of – if one was to consider it geometrically – as an uni-directional line: hence the often heard phrase ‘the arrow of time.’ A slightly more sophisticated way of describing this quasi-intuitive view of time is that time is one dimensional (and is one of the dimension’s of the post-Einsteinian view of ‘space-time’) and only moves (relatively speaking) ‘forward.’ [3]

Assuming time has shape, can you bend, stretch, contract, or otherwise re-shape time? To answer this question, we should make a distinction between mind time and clock time.

With mind time, the answer to the question of the flexibility of time is yes. From an intuitive perspective, for any given length of clock time, we have all experienced the sense that time was ‘slowing down’, stretched out, and/or extended when we are experiencing some exciting, mentally challenging, or stressful event. Examples of this include taking exams, receiving medical treatments, and trading in the financial markets. Neuroscientist, Antonio R. Damasio, gave an example of this from his personal experiences:

On a recent flight with heavy turbulence, for instance, I experienced the passage of time as achingly slow because my attention was directed to the discomfort of the experience. [4]
When things become less nerve-racking or a situation is purely hedonic, however, we perceive time to pass more quickly even if, in terms of clock time, the absolute amount of time for either classes of events were the same.

Philosophers, in particular, Immanuel Kant, have argued in favor of this intrinsic notion of time bending and stretching in accord with human perception. Neuroscientists, including Benjamin Libet [5] and Antonio R. Damasio, have demonstrated experimentally that there seems to be a great deal of validity to the Kantian notion of time – which neuroscientists have dubbed ‘mind time.’ Prof. Damasio summarized his findings on the neuroscience of mind time in the following way:

The emotional content of the material may also extend time. When we are uncomfortable or worried, we often experience time more slowly because we focus on negative images associated with our anxiety. Studies in my laboratory show that the brain generates images at faster rates when we are experiencing positive emotions (perhaps this is why time flies when we’re having fun) and reduces the rate of image making during negative emotions. [6]
But what about clock time? Is clock time – what we normally think of as the ‘proper’ measurement of time – malleable as well? Intuition would seem to suggest no. Physics, however, suggests that the shape of clock time may also be flexible. Einstein, as a part of his Theory of Relativity, came up with a thought experiment known as the ‘Twin Paradox.’ According to Relativity, a traveler moving at great distances through space at close to the speed of light would experience clock time at a substantially slower pace than would his or her twin who is relatively stationary. [7] Even quantum mechanics seem to suggest that clock time may not be as deterministic as we may intuitively believe it to be. [8]


Before we move on, it’s worth noting what it would mean to re-shape either mind time and/or clock time. Time, as has been already mentioned, is one dimensional (practically speaking). When time is deformed, it may no longer be one dimensional since it may not be a platonic ‘line’ in the strict Euclidean sense. Is it two dimensional (or have an even higher dimension)? Perhaps. But, it is probably more mathematically correct to think of it as having a dimensionality somewhere between one and two (or more) dimensions. In other words, rather than thinking in terms of integer dimensions (1, 2, 3, …), we should think of deformed time as occupying fractional dimensions (1 1/4, 1 1/3, 1.5, etc.). When we are dealing with fractional dimensions, we are really dealing with fractals (‘fractional dimension’ or, what Benoit Mandelbrot might call ‘the degree of roughness’, being one aspect of the notion of fractals).

The application of fractals to the flexibility of mind time (and, I suppose, to clock time as well) leads us into to the implications of mind time for the risk and return characteristics of financial markets.

The fifth heresy of finance

“In markets, time is flexible.” According to Benoit Mandelbrot and Richard Hudson, this maxim is number five on their list of the “Ten Heresies of Finance.” As we saw in the second of the introductory quotes to this essay, in Mandelbrot’s multifractal view of financial market dynamics, time “stretches and shrinks …. We perk up during high drama, nod off when bored. Markets do the same.” [9]

In Mandelbrot’s Multifractal Model of Asset Returns, we can start by generating price movement using the usual models (e.g., geometric Brownian motion) using normal clock time time-scales. We can then use another generator to transform clock time into a new time-scale, which Mandelbrot calls “trading time” and which I call ‘market time’ (I will explain why I prefer this nomenclature later in this essay). Mandelbrot’s “trading time” is flexible and malleable; to put it another way, in financial markets, time-scales are rough, i.e., market time is fractal.


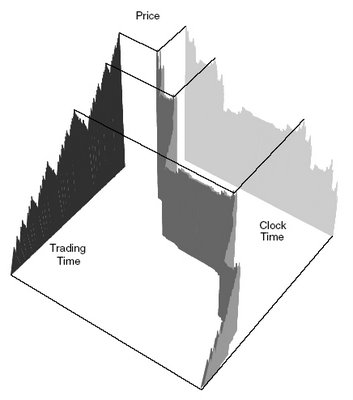
Using the ‘clock time-trading time’ generator, periods of large price movements get expanded, periods of relative quiescence are compressed. We can then use the ‘clock time-trading time’ generator to translate the original price movement generator into a model of asset prices that better resembles actual market conditions than standard neoclassical models used in finance. In Mandelbrot’s (and Hudson’s) words:

[The final price chart] fluctuates wildly. It has the big jumps and “fat tails” we find in real price charts, as well as the long-term dependence and persistence of the real thing. [10]

Benoit Mandelbrot is not alone in believing that “in markets, time is flexible.” Emanuel Derman has theorized that market participants may perceive risk and return in terms of what he calls “intrinsic time” (of course, I refer to this as ‘mind time’ and/or ‘market time’). Derman has incorporated this more malleable conception of time into a modified version of the Capital Asset Pricing Model (CAPM). [11]

So far, we have seen that the neuroscience and philosophical concept of mind time seems to be analogous to and runs parallel with Mandelbrot’s fractal ‘trading time’ and Derman’s ‘intrinsic time.’ Can we tie these concepts together more directly?

We can connect these ideas together if we accept that perception, emotion, and behavioral/cognitive cues & heuristics, play a significant role in financial decisionmaking in the marketplace. There is a growing body of research in behavioral finance & economics, as well as the new field of neuroeconomics, that support the idea that perception, emotion, and other factors not associated with a rigid conception of Homo economicus play substantial roles in financial economic decisionmaking.

One particularly interesting piece of research in this area has been conducted by Andrew Lo and Dmitry Repin. According to research they conducted in a clinical (both in the quasi-medical sense, since equipment used to monitor physiological states was used, and in the sense that the research involved practitioners of finance, in this case traders in the Boston area) setting, they found real-time physiological data that showed statistically significant signs of emotional responses to periods of increased market volatility. [12] If we tie this bit of evidence together with research done by neuroscientists on how mind time stretches during periods of intense emotional exertion, we can see that Mandelbrot and Derman’s conception of flexible time in the markets is an aggregation of the individual mind times at work among market participants.

Mind time, market time, and risk and return

Before we delve into the implications of all of this for financial risk and return, let me define what I mean by market time and why it is important to distinguish this concept from the other concepts offered to explain the flexibility of financial time-scales.

I define market time to be the aggregation of all of the individual mind times of the participants in a financial market. Market time can be thought of in both a macro and micro sense. Specifically, we can define a market time for an entire market or markets of financial assets or we can define a market time for particular segments of any particular financial markets. In a similar vein, we can define a market time that is an aggregation of the mind times of all market participants – traders, investors, et al. – or we can define market times for individual categories of market participants.

One of the reasons why I prefer to call this aggregation of mind timesmarket time’ – as opposed to ‘trading time’ or ‘intrinsic time’ – is because different participants in a market make decisions based on differing time-scales. Traders make decisions based on a framework of days, hours, minutes, and, even, seconds. Investors make decisions based on time-scales that span weeks, months, quarters, and years. The differing time-scales will have differing affects on the shape of market times – whether those market times are defined in macro or micro terms. Thus, it is important to keep in mind that the flexibility of time is not solely dependent on the mind times of traders. The roughness of time-scales in the markets can also depend on the aggregate mind times of long-term investors and other participants in the market that have time-scales that may or may not be similar to that of short-term traders.

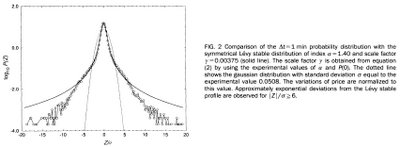
So how does mind time or market time affect the nature of financial risk and return? Following the logic of Benoit Mandelbrot’s Multifractal Model of Asset Returns, the flexible nature of market time causes financial risk to be more discontinuous and ‘jumpy’ as well as more persistent and correlated than standard financial theory allows for. The introduction of ‘rough,’ fractal-dimensioned market time – even when the underlying price movement generator is Gaussian Brownian motion – causes the underlying distribution to resemble a fat-tailed (i.e., makes extreme deviations from the center of the distribution more likely than the so-called ‘normal’ distribution would allow for), non-Gaussian Levy stable distribution.

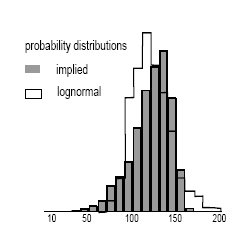
In plainer English, acknowledging the reality that time is flexible in the markets means that we must acknowledge the reality of catastrophic risk of greater magnitudes and frequency than we can with the currently dominant models of finance. This kind of risk – called ‘wild randomness’ by Benoit Mandelbrot and Nassim Nicholas Taleb – is considerably more worrisome than the ‘milder’ variety of risk that is suggested by the so-called ‘normal’ (or log-normal) distribution. [13]

Like the turbulence that Damasio felt while flying, traders and investors will experience financial turbulence because of the specter of ‘wild’ risk in the markets. There is an important difference, however, between turbulence felt in the air and turbulence felt in the markets. Atmospheric turbulence is an exogenous force that deforms the shape of mind time – the perception of the temporal nature of the experience. Market turbulence is, at least in part, endogenous to the market; the collective force of mind times – what I have termed market time(s) – serve to create and/or reinforce the turbulence that further deforms both the shape of perceived time as well as the shape of the distribution of prices and returns (relative to the ‘normal’ distribution).

A few distinctions need to be made between short-term traders and longer-term investors when discussing the affects of malleable mind time / market time on the nature of financial risk and return. Both groups will feel the jarring affects of fat tails and long-term dependence but to varying extents relative to their differing time-scales.

Short-term traders will experience the bumps and bruises of financial turbulence in a much more visceral and intense way relative to long-term investors. Because the first and second central moments of a probability distribution – the mean (expected value or expected return) and variance (standard deviation), respectively – are undefined with the kind of high-peaked, fat-tailed distributions that can result from a world of malleable market time, traders cannot unreservedly place their hopes in the traditional tools they have to ‘hedge’ risk or take advantage of arbitrage opportunities.

In fairness to defenders of more traditional views of finance, one thing worth pointing out that sometimes fails to get noticed among the growing chorus of praise for power laws and fat tails in finance is that most of the time – in terms of clock time (but not mind time) – markets are relatively prosaic. The high-peakedness and the relatively ‘hollowed out’ area between the peak and the extremes in the distributions suggested by most pro-power law, pro-fat tail financial research means that, most of the time, traders will be able to make their Shakespearean “pound of flesh” doing what they usually do with the usual set of tools. In terms of mind time / market time, however, the periods of financial turmoil and turbulence will be extended relative to clock time. Those times of bumps and jumps will either make or break fortunes. The ‘usual’ ways of doing things does not adequately take the potentially catastrophic – either catastrophic ‘success’ or, more often than not, catastrophic failure – affects of flexible market times into account.


Long-term investors will also be affected by market turbulence. However, because they make decisions based on longer time-scales, investors may be able to diversify away some of the nastier risks and be able to smooth out the bumps from the returns on their suitably diversified portfolios. [14] Long-term diversification – if properly carried out – is potentially more robust than dynamic hedging over short time intervals. While investors should not blindly rely on ‘expected return’ or ‘standard deviation’ any more than their trading brethren, investors – via a properly diversified portfolio – might be able to rely on the median of the distribution since the median, while not easy to express mathematically for non-Gaussian Levy stable distributions, does exist for the high-peaked, fat-tailed distributions that we increasingly see in the more promising research into financial econophysics. [15]

When time crawls

Hopefully, we can see the connections between neuroscience, philosophy, mathematics, and, to some extent, physics, and an increasingly sophisticated body of quantitative financial research that suggests that time is flexible and that this malleability of time – or, at least, the perception of time – has some very substantial consequences for the nature of risk and return in the financial markets. Exploring this intersection between the mind and the market led me to create a catchphrase that nicely encapsulates the lessons to take away from this essay: Time crawls when you’re money is at risk.


Notes:

The first figure comes from Lasky, infra note 7. The second figure comes from Benoit Mandelbrot & Michael Frame, Fractals, Graphics, and Mathematics Education (Mathematics Association of America, 2002). The third figure comes from Mantegna & Stanley, infra note 15.

[1] This quote is from Norman Kemp Smith’s classic translation of Kant’s Critique of Pure Reason (2nd ed., Palgrave Macmillan, 2003).

[2] This quote is from the UK paperback edition of Mandelbrot and Hudson’s book. I’m presuming the American version is the same (except for pagination and the spelling of ‘behavior’). The bibliographical information for the U.S. version is Benoit Mandelbrot & Richard L. Hudson, The (Mis)Behavior of Markets (Basic Books, 2004).

[3] It is worth noting that some physicists have made the argument that time does not necessarily have a fixed direction (it only seems that way). In other words, time might not be an arrow. For more on this, see Paul Davies’About Time: Einstein’s Unfinished Revolution (Simon & Schuster, 1995) as well as Paul Davies’ articles for Scientific American Special Edition (2006): A Matter of Time. For a more philosophical / historical take on the physics of time, see Palle Yourgrau’s A World Without Time: The Forgotten Legacy of Gödel and Einstein (Basic Books, 2005).

[4] From Antonio R. Damasio’s article in the Scientific American: A Matter of Time (2006), Remembering When (from the sidebar, How Hitchcock’s Rope Stretches Time).

[5] In fact, Benjamin Libet, of UCSF, seems to have coined the term ‘mind time.’ See his book Mind Time: The Temporal Factor in Consciousness (Harvard Univ. Press, 2004).

[6] From Damasio, supra note 4.

[7] A good description of the Twin Paradox is Ronald C. Lasky’s How does relativity theory resolve the Twin Paradox? (found on the website of Scientific American). An extremely brief tutorial on Relativity can be found at http://www.astro.ucla.edu/~wright/relatvty.htm

[8] See Hans Reichenbach, The Direction of Time (Dover, 1999, republication of Univ. of California Press, 1956).

[9] Mandelbrot & Hudson, supra note 2.

[10] Ibid.

[11] Emanuel Derman, The Perception of Time, Risk, and Return During Periods of Speculation (Quantitative Finance, 2002, vol. 2, 282-296).

[12] Andrew W. Lo & Dmitry V. Repin, The Psychophysiology of Real-Time Financial Risk Processing (Journal of Cognitive Neuroscience, 2002, 14:3, pp. 323-339).

[13] Both of these gentlemen have written extensively on these concepts. See, e.g., Benoit Mandelbrot & Nassim Taleb, A Focus on the Exceptions that Prove the Rule (published in a Financial Times supplement on “Mastering Uncertainty”, 2006). Copies of this article are available (divided into two pages) at:
http://www.fooledbyrandomness.com/FT-1.pdf
http://www.fooledbyrandomness.com/FT-2.pdf

[14] The emphasis is on ‘suitably’ for a reason: Most so-called diversified portfolios are probably not nearly diversified enough in relation to non-Gaussian distributions that give a more accurate picture of the nature of financial risk. See Mandelbrot & Taleb, How the Finance Gurus Get Risk All Wrong (Fortune, July 11, 2005).

[15] One of the pioneering papers in this genre was R. N. Mantegna and H. E. Stanley, "Scaling Behaviour in the Dynamics of an Economic Index," Nature 376, 46-49 (1995).

Thursday, April 20, 2006

Tyler Cowen on Neuroeconomics in the New York Times

I just read Tyler Cowen's, an economist at George Mason University, 'Economic Scene' column in the New York Times. He wrote a piece on the new and exciting field of neuroeconomics: Enter the Neuro-Economists: Why Do Investors Do What They Do? (NYT, April 20, 2006).

Here are some snippets from the article:

For the first time, economists are studying these phenomena scientifically. The economists are using a new technology that allows them to trace the activity of neurons inside the brain and thereby study how emotions influence our choices, including economic choices like gambles and investments.

For instance, when humans are in a "positive arousal state," they think about prospective benefits and enjoy the feeling of risk. All of us are familiar with the giddy excitement that accompanies a triumph. Camelia Kuhnen and Brian Knutson, two researchers at Stanford University, have found that people are more likely to take a foolish risk when their brains show this kind of activation.

But when people think about costs, they use different brain modules and become more anxious. They play it too safe, at least in the laboratory. Furthermore, people are especially afraid of ambiguous risks with unknown odds. This may help explain why so many investors are reluctant to seek out foreign stock markets, even when they could diversify their portfolios at low cost.

If one truth shines through, it is that people are not consistent or fully rational decision makers. Peter L. Bossaerts, an economics professor at the California Institute of Technology, has found that brains assess risk and return separately, rather than making a single calculation of what economists call expected utility.

The Times' piece goes on to discuss Andrew Lo (of MIT's) work in this area: e.g., The Psychophysiology of Real-Time Financial Risk Processing, with Dmitry V. Repin, Journal of Cognitive Neuroscience 14(2002), 323-339. Although, strictly speaking, it's not really neuroeconomics (it's more like physio-economics or perhaps cognitive economics), I thought it was interesting research when I first came across it a few years ago.

Prof. Cowen adds some wise words of caution regarding the possible applicability of neuroeconomics:
[T]he setting may matter. Perhaps we cannot equate choices made on the New York Stock Exchange trading floor with choices made under a hospital scanner, where the subject must lie on his back, remain motionless and endure a loud whirring, all the while calculating a trading strategy.

Tuesday, April 18, 2006

The Earthquake Paradox: A Probability Puzzle

Today (April 18, 2006) is the 100th anniversary of 'The Great Quake' in the San Francisco Bay Area. This reminded me of a puzzle in probability that I came up with a while back (as far as I know it, this idea is original to me since I haven't heard of this before) that I call the 'Earthquake Paradox.'

I came up with the Earthquake Paradox when I came across the 24-hour major earthquake probability prediction map of California created by the U.S. Geological Survey (USGS) (http://pasadena.wr.usgs.gov/step/). According to the USGS, "there is a 62% probability of at least one magnitude 6.7 or greater quake, capable of causing widespread damage, striking somewhere in the San Francisco Bay region before 2032." The risk of a major earthquake, if anything, is probably being understated; most geologists' intuitions would tell them that it is almost certain that there will be a major earthquake in California in the next few years. At any rate, most geologists believe that it is almost certain that California will suffer a number of catastrophic earthquakes in the decades to come.

Yet, on most days, when you look at the probability prediction map for major earthquakes (major earthquakes being 5.0 or above on the Richter Scale and a 'VI' on the Modified Mercalli Index) in California, the chances of a major quake are quite low. For example, looking at the portion of the probability map for the San Francisco Bay Area, the probability of a major earthquake hitting San Francisco in the next 24 hours, on most days (most people would think of it as the 'average' range of probabilities), ranges from 0.0001 to 0.00001 (i.e., usually less than 1% chance within a 'typical' 24 hour period).

So here is the paradox: How can it be that, over the not too distant long run (which includes the possibility that the event could take place within the next few days), it is nearly certain that California will experience a major earthquake, but, on a 'typical' (or 'average' or 'most') day(s), the probability of a major earthquake happening is fairly small?

I don't want to get into all of the reasons why I think this 'Earthquake Paradox' exists due to the constraints of space and time on a blog like this, but let me give an extremely brief glimpse of my thoughts on this matter. I believe that the Earthquake Paradox exists because of both mathematical and psychological reasons.

The mathematical / statistical reason for the existence of this paradox is, in part, due to the idea that randomness and risk does not always conform to the so-called 'normal' (Gaussian) distribution that is commonly used in both the social and the natural sciences. If we find that -- in both nature and in human social dynamics -- probabilities work in 'wild' and discontinuous ways (with unpredictable 'jumps,' etc.) compared to the way we are typically taught that chance works, then the paradoxical situation of having long term near certainty with short term unlikelihood is plausible from a mathematical standpoint. By the way, this is reminiscent of what Benoit Mandelbrot and Nassim Nicholas Taleb have been preaching -- the distinction between "wild randomness" and "mild randomness" in finance -- recently.

The psychological explanation for the Earthquake Paradox (again very briefly due to constraints) is because people tend to discount (I'm using this word in a technical sense as it is used in finance, economics, and more quantitative branches of psychology) future values -- be they prices or probabilities. Simple discounting, as understood by economists and some psychologists, wouldn't adequately explain the paradox. However, if we can accept the idea that people tend to more drastically discount future values and possibilities than allowed for by typical financial theory (and other disciplines), then the paradox, again, begins to be plausible. I believe that humans often base their discounting of the future based on what can be loosely termed as a 'hyperbolic' function. For some strange reason, economists seem to think that using a hyperbolic function is somehow less 'rational' than using the utility discounting function that underlies standard models; from a purely mathematical or scientific perspective, using such a discounting function is not any less 'rational' than using the function preferred by economists.

One final note ... there is an interesting link between geology / geophysics and finance / econophysics. Didier Sornette, a geophysicist at UCLA, has done some interesting research on financial econophysics. Perhaps there is a greater overlap between these seemingly disparate fields than meets the eye.


Forensic Economics of 'Credence Goods'

I just read a fascinating article in The Economist titled: Sawbones, cowboys and cheats: Is your doctor, mechanic or taxi-driver cheating you? Economics can help. The article discusses two research papers by economists examining the problem of 'credence goods.' Economists define 'credence goods' to be goods and services (actually, it is usually more about service than goods, so it really should be called 'credence services') where there is a major asymmetric information problem between the consumer and the supplier. For example, how does a layman know if a doctor has done too much (or too little) of some medical procedure?

According to the article, a Swiss economist found that physicians tended to perform less unnecessary procedures on other doctors and relatives of lawyers. Why? Because those classes of patients either had less of an asymmetric information problem or the supplier had strong incentives to not cheat their customers.

The Economist article also mentioned a research paper -- titled, On Doctors, Mechanics and Computer Specialists - The Economics of Credence Goods -- that found that, if consumers were cognizant of the 'credence goods' problem and took actions to remedy the situation, the market would re-align the incentives enough to substantially reduce the problem. The ideal situation (the equilibrium price if the theory pans out) would be where the suppliers of credence goods would charge a flat fee ... raise the prices of simpler services and lower the price of more complicated services.

By the way, I wrote a blog piece on the forensic economics of sports betting a while back that was in a similar spirit to this post.

Monday, April 17, 2006

Vote Buying & Financial Engineering: The Other Reason to Borrow Shares

Usually, financial speculators borrow shares to 'short sell' -- bet that that the stock's price will drop before the borrowed shares have to be returned, thereby resulting in a profit for the short seller (i.e., borrower/speculator). However, according to financial econometric research conducted by a group of finance professors, there is an entirely different and novel reason why some market participants borrow shares: to buy votes.

For those of you not familiar with corporate governance issues, here is a little bit of remedial Corporate Law 101:

------

(1) Traditionally, holding shares of stock in a corporation conferred the right to the shareholder to vote on certain corporate governance matters. Today, only certain classes of shares -- common stock and preferred stock with voting rights -- confer this right.

(2) Traditionally, the law has generally frowned upon vote trading under the 'one share-one vote' rule (it should be noted that, under corporate law, some classes of shares may confer more or less than one vote per share). The better explanation for this attitude is that it has seemed unseemly to trade (sell and/or purchase) votes even in a profit-driven atmosphere of a corporation (as opposed to the buying and selling of votes in a political context).

(3) Normally, holding shares with voting rights in a U.S. corporation at a particular point in time called the 'record date' (used as a time marker to identify 'the registered owner(s)' of the stock in question) confers on that shareholder the right to vote on various corporate governance matters at the annual shareholder meeting or via proxy voting.

------

Notice the bolded parts of section (3); it turns out that there is a 'loophole' (if you're inclined to think in that way) in U.S. corporate & securities laws (corporate laws are usually administered by the individual states, with most publicly traded U.S. corporations incorporated under Delaware law; securities law, although states do have limited jurisdiction over it, is mostly administered by the federal government via the Securities & Exchange Commission and the Justice Department) that essentially means that one does not have to actually hold or own the shares beyond the record date to cast a vote so long as the borrower of the shares is, technically, 'the registered owner' (even if the borrower is not the real owner). (Note: Like the U.S., most 'common law' jurisdictions -- notably England where U.S. 'companies law' originated from -- will allow certain classes of shareholders to vote on corporate governance matters. However, I don't know if they have similar 'loopholes.' The research paper, does make the point that -- since England does not have the type of restrictions against short selling, the typical reason to borrow shares, that the U.S. has -- there is probably an active market in vote trading via the securities lending market.)

Mark Hulbert, in his New York Times piece (April 16, 2006), One Borrowed Share, but One Very Real Vote, summarized the implications of the research with the following paragraph:
As the study points out, the right to vote on a corporate resolution comes from possession, not ownership, of shares. That means a trader can borrow shares and thus be temporarily eligible to vote on corporate resolutions. The number of votes he can acquire is limited only by his ability to put up collateral -- which is required to be 102 percent of the value of shares borrowed -- and the number of shares available on the securities lending market. This market primarily serves those who wish to borrow shares in order to sell them short, but there is nothing to prevent its use by those whose motive is to influence the outcome of corporate votes.
In my opinion, Mark Hulbert -- in an otherwise fine descriptive article of the research paper -- didn't adequately understand the legal principle that the research paper is concerned with. It is the timing of the holding of the shares (i.e., holding it on the record date) and not the distinction between ownership and possession that is at issue here. In fact, it is hypothetically possible under the law that, where shares are being lent/borrowed, someone who does not even possess the shares can still have the voting rights so long as that person is, technically, 'the registered owner.'

The researchers -- finance professors from McGill University, Wharton (Penn), and University of North Carolina -- utilized econometric techniques to examine data from the securities lending market on and around over 6,000 'record dates' for a one year period from November 1998 to October 1999. The researchers found that there was a substantial spike in the number of borrowed shares on the record date. Furthermore, the level of borrowing in shares declined dramatically the day after the record date -- returning to nearly the same level as the days preceding the record date. Based on the econometric evidence, as well as qualitative reasoning, the researchers concluded that the most plausible reason for this type of pattern in the data is that speculators borrowed shares -- not to short sell (which, again, is the typical reason to borrow shares) -- but to buy votes.

The researchers also found that, in most cases, the cost of buying votes was extremely low; so low, in fact, to be almost negligible. According to one of the co-authors (Prof. Reed of UNC), presuming that the borrower of shares had sufficient collateral, the cost to borrow $1 million of stock for one day (in this case, the record date) "could be less than $6."

Who would buy votes by borrowing shares? At least in the one year period studied, this tactic was employed by anti-management factions of shareholders. The researchers concluded that there appeared to be no reason why corporate management couldn't use the same tactic to influence votes in their favor.

My non-legally binding opinion on this last point is that shareholders completely outside of the sphere of influence of management is more likely to be able to use this tactic than corporate management itself. Why? There is a principle that generally applies in U.S. corporate law (i.e., most states' corporate law) called 'self-dealing transactions' that might cause this type of 'acquiring shares to influence voting' scheme to come under greater scrutiny by the courts and the SEC.

Having said that, this study has some very interesting implications for the in vogue field of corporate governance. This type of tactic could throw a monkey wrench into corporate governance reforms, especially if unscrupulous corporate managers (e.g., Enron's supposedly 'smartest guys in the room') adopted this tactic and managed to either dodge detection or find legal loopholes to shield their attempts to artificially manipulate votes away from the best interests of non-management shareholders.

At any rate, whatever one thinks of the implications for corporate governance, one thing that everyone should be able to agree on is that this is yet another example of 'financial engineering' at work: Creating a virtual, covert market for vote trading via the securities lending market where a more overt market does not exist for institutional and/or legal reasons.

[You can download a copy of the research paper, Vote Trading and Information Aggregation, at http://papers.ssrn.com/sol3/papers.cfm?abstract-id=686026 ]

Fibonacci Poem Network

I just ran across an interesting New York Times article, Fibonacci Poems Multiply on the Web After Blog's Invitation (April 14, 2006). It talks about a blog -- http://gottabook.blogspot.com/ -- that encourages readers to write poems based on the mathematical concept of Fibonacci sequences (0, 1, 1, 2, 3, 5, 8, etc. -- where the first two digits are 0 & 1 and subsequent digits are the sum of the previous two digits). Assuming that the initial 'line' has no syllable, the next (which would be the first actually written line) line would have one syllable, the line after that would have one syllable, the line after that would have 1+1 = 2 syllables, and goes on in that fashion until the final line (one with eight syllables). An example (from the Times article):

Blogs
spread
gossip
and rumor
But how about a
Rare, geeky form of poetry?
What I found interesting about this article was that it is a perfect example of a social network developing from a combination of a shared interest (Fibonacci sequenced poetry) and blogging on the Internet.

By the way, I tried to come up with a Fibonacci poem on some Econophysics related theme. I haven't come up with anything yet! Readers are more than welcomed to try and come up with an Econophysics Fibonacci poem and post it in the comments.


Thursday, April 13, 2006

Deal or No Deal Redux: Behavioral Economics of the TV Game Show

Another blast from the blogging past ... I wrote a blog entry a while back about the TV game show Deal or No Deal on NBC (in the U.S.) titled Deal or No Deal: Risk Aversion, Loss Aversion, and Fair Odds (or lack thereof). In that blog entry, I wrote about my observations and thoughts about the the possible implications of the game show for our understanding of decision making in the face of risk and uncertainty. I also mentioned an article by two economists who had studied the Italian version of the show.

I just came across another research article on the show. It is co-written with Richard Thaler, a behavioral economist at the University of Chicago. It analyzes the show based on the versions of the show in Belgium, Netherlands, and Germany. You can download the paper at http://papers.ssrn.com/sol3/papers.cfm?abstract_id=636508

The following is from the abstract of the paper:

The popular TV game show “Deal or No Deal” offers a unique opportunity for analyzing decision making under risk: it involves very large and wide-ranging stakes, simple stop-go decisions that require minimal skill, knowledge or strategy, and near-certainty about the probability distribution. We examine the choices of 84 contestants from Belgium, Germany and the Netherlands. In contradiction with expected utility theory, choices can be explained in large part by the previous outcomes experienced by the contestants during the game. Most notably, risk aversion decreases strongly after earlier expectations have been shattered by unfavorable outcomes, consistent with the “break-even effect”. Our results point in the direction of frame-dependent choice theories such as prospect theory and suggest that phenomena such as framing and path-dependence are relevant, even when large real monetary amounts are at stake.

As far as I know it, no one has yet put out a similar research paper based on the American version of the show. Stay tuned!

New Scientist: Mamma mia! Eurovision voting scandal uncovered

I just read a story off of the New Scientist (a UK science periodical) magazine's website that discusses a computer simulation that indicates cheating in the voting for the Eurovision Song Contest. Americans may not be familiar with Eurovision ... basically think of it as a really cheesy version of American Idol. (E.g., among Eurovision's former winners was 70s quasi-disco/elevator pop music group ABBA ... apologies to any ABBA fans out there). You can read the story either in the print edition or at http://www.newscientist.com/article/mg19025474.900-mamma-mia-eurovision-voting-scandal-uncovered.html .

I'm posting this entry since it reminded me of what I wrote about in my blog post on 'forensic economics': March Madness?: Basketball, Bookies, Point Shaving, and Forensic Economics

Just in case you can't buy New Scientist at a newsstand near you or the URL goes dead, I am excerpting the article below:


Mamma mia! Eurovision voting scandal uncovered
13 April 2006
From New Scientist Print Edition

ABBA, the Swedish pop phenomenon of the 1970s and 1980s, found fame by winning the cheesy Eurovision Song Contest. Now, shockingly, it seems that the voting on this cherished European institution is subject to collusion that can skew the results.

Eurovision is an annual contest in which European countries elect a national song and award scores to others in the final. Some people suspect conspiracy in the voting. Greece and Cyprus, for example, always seem to favour each other. So Derek Gatherer, a computer programmer from Glasgow, UK, decided to investigate. He ran computer simulations to find the possible range of results if countries voted without bias between 1975 and 2005, and compared that to the real results.

Sure enough, conspiracy was afoot. In the early years, collusive partnerships between countries came and went. Since the mid-1990s when public telephone voting was introduced, however, a large "Balkan bloc" centred on Croatia has emerged to battle with a mighty "Viking empire" of Scandinavian and Baltic states. The copycat voting is now powerful enough to determine the contest's outcome (Journal of Artificial Societies and Social Simulation, vol 9 (2), p 1).

Gatherer says he thinks the collusion has become part of the fun and says he doesn't plan to warn the contest organisers: "I think they probably already know."

His tip to win the contest in May? Bosnia-Herzegovina.

From issue 2547 of New Scientist magazine, 13 April 2006, page 23

Monday, April 10, 2006

Behavioral Finance: Choosing the Same Portfolio at a Higher Cost

I wrote a blog a while back about behavioral economics & finance at Harvard (I specifically mentioned the work of David Laibson in that blog). I found an interesting article in the New York Times (Mark Hulbert's column) on the topic of behavioral finance: Same Portfolio, Higher Cost. So Why Choose It? (April 9, 2006).

The article discusses a research paper co-written by Prof. Laibson, James J. Choi of Yale, and Brigitte C. Madrian of Wharton (Penn), entitled Why Does the Law of One Price Fail? An Experiment on Index Mutual Funds. This article discusses a series of experiments that found that students (both undergraduate and MBA) at Harvard and Wharton (both groups, by the way, scored high on tests of financial literacy given before the experiments) failed to minimize fund fees even though all of the funds were based on the same 500 stocks of the S&P 500 index! A substantial proportion of the subjects of the experiment (usually by an overwhelming majority -- approximately 80% in one scenario) choose higher cost funds even though they all had the same performance, thus, failing to maximize returns.


From Mark Hulbert's column:
As a result, the hypothetical portfolios built by most of the students paid much higher fees than were necessary: 1.22 percentage points more, on average, among the undergraduates and 1.12 points higher among the M.B.A. students.

This is the kind of 'anomaly' that is red meat for behavioral finance / economics researchers. I will leave you with some interesting comments made by the New York Times piece:
What conclusions emerge from all these tests? Over all, the study said, the results do "not inspire optimism about the financial choices made by most households."

The professors also concluded that the presentation of data could have a big effect on investors' decisions. And they argued that this offered a particularly important lesson for policy makers who are thinking about establishing personal investment accounts for workers in the Social Security system. Without careful guidance, the study said, most people won't be able to invest their money intelligently.

Thursday, April 06, 2006

The Sardonic Smirk: The Volatility Smile and the Asymmetry of Risk

A volatility smile is the pattern formed when implied volatility (defined as the volatility necessary to make the Black-Scholes value of an option equal to the option's market value) is graphed relative to the strike price of the option (holding all other factors equal). [The 'strike price' is often stated as a percentage of the underlying's market price when graphing the implied volatility smile.] If the assumptions of the Black-Scholes theory held in the real world -- specifically, constant volatility -- then there should be no volatility smile; instead, we should only see a flat horizontal line. In real world data, however, we often see a volatility smile. This smile flies in the face of the original assumptions of the Black-Scholes option pricing model.


It turns out that the volatility smile comes in different shapes and forms. One of the most problematic is the so-called 'volatility skew' -- a volatility smile that is skewed towards one side. The skewed volatility smile is sometimes called a 'volatility smirk' because it looks more like a sardonic smirk than a sincere smile.

In the equity options market, the volatility smirk is often negatively skewed -- where lower strike prices for out-of-the money puts (options with the right to sell) have higher implied volatilities (and, thus, higher valuations). This pattern, for post-1987 crash equity index options, was first noticed (in academia) by Mark Rubinstein in his 1994 classic, Implied Binomial Trees. According to Emanuel Derman -- in his book, My Life as a Quant : Reflections on Physics and Finance -- this phenomena is no longer limited to equity options: "During the 1990s, the smile, initially a peculiarity of equity options, infected other markets ..." (p. 226).

An important implication of a negatively skewed volatility smile is that way out-of-the-money puts had market valuations well beyond that predicted by Black-Scholes. There are two possible explanations for this. The first explanation is that Black-Scholes is correct and, thus, the market is incorrectly over-valuing these options. This line of thinking is probably wrong since most people concede based on mounting evidence -- not the least of which is the volatility smile itself -- that the simplistic Black-Scholes option valuation model is flawed.

The better explanation is offered by Emanuel Derman in pp. 227-228 of his book:


Anyone who was around on October 19, 1987 could easily guess why [low-strike puts are so relatively expensive]. Ever since that day when equity markets around the world plunged, investors remained constantly aware of the possibility of an instantaneous large jump down in the market, and were willing to pay up for protection. Out-of-the-money puts were the best and cheapest insurance. Like stableboys who shut the barn door after the horse bolted, investors who lived through the 1987 crash were now willing to pay up for future insurance against the risks they had previously suffered.


In other words, markets are doing what the theorists had not done: attempting to price in the possibility of catastrophic risk. Standard theories -- based on the framework of the Gaussian / 'Normal' probability distribution -- tended to underestimate the risk of the bottom falling out.

I believe that the volatility smirk -- specifically the negative skewed volatility smile -- has some important implications for the nature of financial risk. Under the standard 'bell curve' / geometric Brownian motion for securities prices framework, risk is seen as being symmetric; i.e., downside risk is not truly distinguished from upside 'risk.' What the volatility smirk / smile is telling us is that there is a distinction between downside risk and upside 'risk' (which, in this case, matches common sense). The more prices go down, the greater the riskiness (as measured by volatility) becomes.


We can see from the diagram above that the probability distribution derived from implied volatilities of index options (i.e., actual market data) is left 'fat-tailed' compared to what we might expect if the probability distribution of index values actually reflected the standard assumption of log-normality. In other words, market data tends to show that there is a substantially greater probability for catastrophic losses than would be predicted from the standard log-normal / geometric Brownian motion model of asset prices.

Furthermore, risk is not symmetric: Downside risk is much more damaging in the real world than theoretical models would anticipate because, as suggested by the smirk, downside risk is correlated with downward movement in prices. Thus, a downward shift in prices can be like an avalanche ... a downward tumble can feed on itself and, if the conditions permit, become a destructive torrent that wipes away the fortunes of even the 'savviest' investors and traders.


Monday, April 03, 2006

Mandelbrot & Taleb on "Wild Randomness" in the Financial Times

and recently co-wrote a piece for the Financial Times where they talk about what Mandelbrot has called "wild randomness" -- which puts more weight on extreme events than does "mild randomness" that we are accustomed to under the Gaussian / 'normal' distribution assumption. In a world of wild randomness, the so-called outliers become as (or are sometimes even more important) than more frequently occurring events because of the nature of fat-tailed, leptokurtic probability distributions and scalable power laws that are more likely to be representative of the true nature of most financial markets than the 'log-normal' distribution.

You can get the FT article (2 pages) at the following links:
http://www.fooledbyrandomness.com/FT-1.pdf

http://www.fooledbyrandomness.com/FT-2.pdf