The Sardonic Smirk: The Volatility Smile and the Asymmetry of Risk

It turns out that the volatility smile comes in different shapes and forms. One of the most problematic is the so-called 'volatility skew' -- a volatility smile that is skewed towards one side. The skewed volatility smile is sometimes called a 'volatility smirk' because it looks more like a sardonic smirk than a sincere smile.
In the equity options market, the volatility smirk is often negatively skewed -- where lower strike prices for out-of-the money puts (options with the right to sell) have higher implied volatilities (and, thus, higher valuations). This pattern, for post-1987 crash equity index options, was first noticed (in academia) by Mark Rubinstein in his 1994 classic, Implied Binomial Trees. According to Emanuel Derman -- in his book, My Life as a Quant : Reflections on Physics and Finance
An important implication of a negatively skewed volatility smile is that way out-of-the-money puts had market valuations well beyond that predicted by Black-Scholes. There are two possible explanations for this. The first explanation is that Black-Scholes is correct and, thus, the market is incorrectly over-valuing these options. This line of thinking is probably wrong since most people concede based on mounting evidence -- not the least of which is the volatility smile itself -- that the simplistic Black-Scholes option valuation model is flawed.
The better explanation is offered by Emanuel Derman in pp. 227-228 of his book:
Anyone who was around on October 19, 1987 could easily guess why [low-strike puts are so relatively expensive]. Ever since that day when equity markets around the world plunged, investors remained constantly aware of the possibility of an instantaneous large jump down in the market, and were willing to pay up for protection. Out-of-the-money puts were the best and cheapest insurance. Like stableboys who shut the barn door after the horse bolted, investors who lived through the 1987 crash were now willing to pay up for future insurance against the risks they had previously suffered.
In other words, markets are doing what the theorists had not done: attempting to price in the possibility of catastrophic risk. Standard theories -- based on the framework of the Gaussian / 'Normal' probability distribution -- tended to underestimate the risk of the bottom falling out.
I believe that the volatility smirk -- specifically the negative skewed volatility smile -- has some important implications for the nature of financial risk. Under the standard 'bell curve' / geometric Brownian motion for securities prices framework, risk is seen as being symmetric; i.e., downside risk is not truly distinguished from upside 'risk.' What the volatility smirk / smile is telling us is that there is a distinction between downside risk and upside 'risk' (which, in this case, matches common sense). The more prices go down, the greater the riskiness (as measured by volatility) becomes.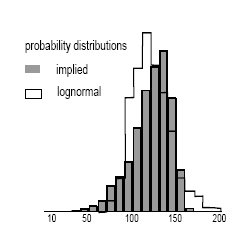
We can see from the diagram above that the probability distribution derived from implied volatilities of index options (i.e., actual market data) is left 'fat-tailed' compared to what we might expect if the probability distribution of index values actually reflected the standard assumption of log-normality. In other words, market data tends to show that there is a substantially greater probability for catastrophic losses than would be predicted from the standard log-normal / geometric Brownian motion model of asset prices.
Furthermore, risk is not symmetric: Downside risk is much more damaging in the real world than theoretical models would anticipate because, as suggested by the smirk, downside risk is correlated with downward movement in prices. Thus, a downward shift in prices can be like an avalanche ... a downward tumble can feed on itself and, if the conditions permit, become a destructive torrent that wipes away the fortunes of even the 'savviest' investors and traders.
posted by The Econophysics Blog @ 9:52 pm
![]()
![]()


0 Comments:
Post a Comment
<< Home